


Analytics Pro
Switch on popup analytics, read the dashboard of views, conversions and dismissals, export the numbers and send events to Google Analytics.
Analytics shows how your popups perform: how often each was seen, how often it converted, how often it was closed, and where, when and on which devices. Everything is recorded on your own site.
Switch analytics on#
- Go to Wing Popup → Settings → Analytics.
- Switch on Enable Analytics.
- Choose What Counts as a Conversion.
- Click Save.
| Field | What it does |
|---|---|
| Enable Analytics | Records views, dismissals, clicks and conversions. |
| What Counts as a Conversion | A form in the popup is submitted, The call-to-action button is clicked, or Either of the above. Everything is recorded either way; this only decides which number the reports call the conversion rate. |
| Keep Detailed Events For | Days before individual events are deleted. 30 by default. Daily totals and every breakdown are kept permanently, so charts and history are not affected. |
The first figures appear within an hour of a popup being shown: events are gathered and added to the daily totals once an hour.
The dashboard#
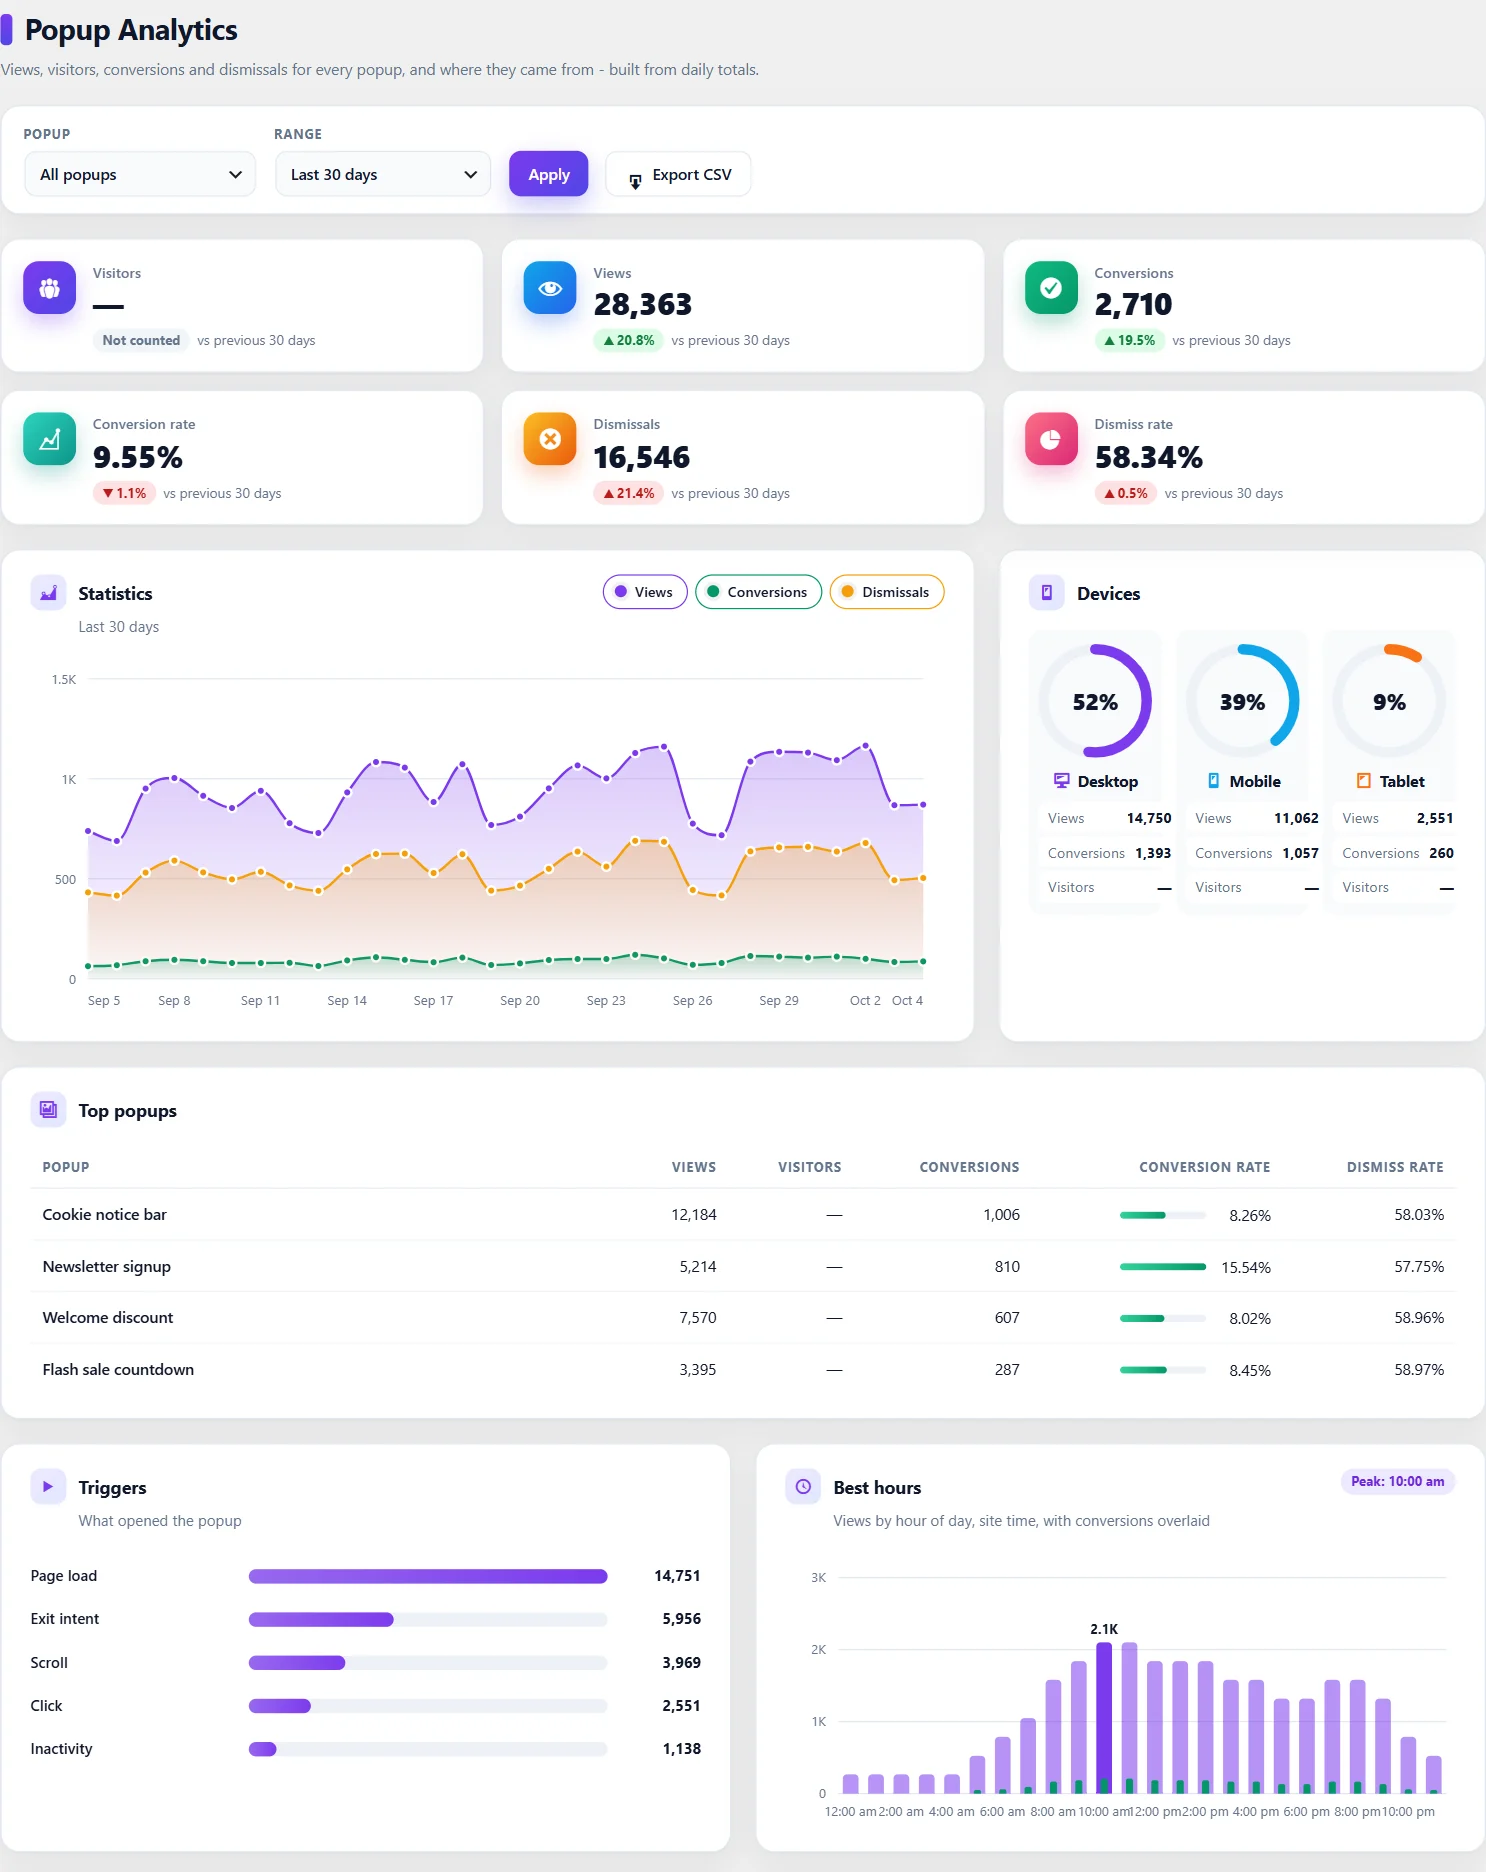
Open Wing Popup → Analytics.
Filters#
- Popup: all popups, or one.
- Range: Today, Yesterday, Last 7, 30 or 90 days, This month, Last month, or a custom range.
- Export CSV downloads the figures for the chosen popup and range.
The numbers#
| Card | Meaning |
|---|---|
| Views | How many times a popup was shown. |
| Visitors | How many different visitors saw one. Shown only when unique visitors are counted (see below). |
| Conversions | Form submissions, button clicks or both, as you chose in the settings. |
| Conversion rate | Conversions divided by views. |
| Dismissals | How many times a popup was closed without converting. |
| Dismiss rate | Dismissals divided by views. |
Under each number is the change against the previous period of the same length: the last 30 days against the 30 days before.
The charts and tables#
| Section | What it shows |
|---|---|
| Statistics | Views, conversions and dismissals per day. |
| Devices | The share of desktop, mobile and tablet, with each one's views and conversions. |
| Top popups | Every popup's views, conversions, conversion rate and dismiss rate. Start here to see what works. |
| Triggers | What opened the popups: page load, exit intent, scroll, click and so on. |
| Best hours, Days of week | When popups are seen and when they convert. |
| Pages, Referrers | The pages popups appeared on, and the sites visitors came from. |
| Countries, Browsers, Operating systems | Where and with what visitors browse. |
| A/B tests | The results of running tests. See A/B testing. |
Reading the numbers#
- A high dismiss rate with few conversions means the popup is not wanted at that moment. Try a later trigger, a narrower audience or a different offer.
- Compare triggers. If exit intent converts at twice the rate of page load, show the popup less on load.
- Look at devices separately. A popup that works on desktop may be too large or too early on phones.
- Change one thing at a time, or run an A/B test and let the numbers decide.
Unique visitors#
Under Settings → Analytics → Visitors, Count Unique Visitors stores an anonymous, rotating identifier in the visitor's browser so repeat views by the same person are not counted twice. It is off by default: such an identifier is treated like a cookie under privacy law and may need consent. Browsers that send Global Privacy Control or Do Not Track are left out automatically.
With it off you still get every total and rate; only the Visitors card shows Not counted.
Google Analytics#
To see popup events next to your other site data:
- Go to Settings → Analytics → Google Analytics.
- Switch on Send Events to Google Analytics.
- Optionally change the Event Name Prefix (
wdpopby default).
Events then arrive as wdpop_impression, wdpop_conversion and so on, through whichever Google tag is already on your site. Wing Popup does not install Google Analytics and never loads it itself.
Privacy#
Analytics counts events. It never stores an IP address, a full browser signature, a user ID, a full URL or anything a visitor typed. Countries come from your host's or CDN's location headers; browsers and operating systems are recorded as family names only (Chrome, Windows).
If the dashboard stays empty#
- Analytics was switched on only recently: wait an hour.
- No active popup was shown in the chosen range. Widen the range.
- Your own visits count too. View a popup in a private window and check again after an hour.
- If the screen reports that its tables are missing, click Create tables there.
Did this not answer your question?
Send us what you are trying to do and we will help, and improve this page.